
Portfolio & Market Review: November 2018

Market Update
November was a volatile month as markets had a mixed reaction to disappointing economic data, a plunge in oil prices, lower estimates on future earnings growth, and softer language from the Federal Reserve (Fed) chairman Jerome Powell about the future path of interest rates. The month began with a rebound from October, but the rally was short lived as equity markets across the world retested the October lows as economic data rolled in. If not for Powell’s speech on November 28th, which gave way to a 5% rally in US stocks, November returns would have ended in negative territory.
Throughout the month, the price of oil was a major headline as Brent oil fell 22% to $58/barrel, on fears that market fundamentals have weakened. The market action in oil was spurred on by an unexpected decrease in US sanctions on buyers of Iranian oil, in addition to weaker demand in some of the world’s largest economies and unexpected supply increases from the US and OPEC countries. From a macro perspective, lower oil prices will have mixed effects on the economies of oil importers and exporters, but in aggregate, $60 oil should be better for the global economy, so long as the pull back was supply driven and not a reflection of global demand.
Global equities finished the month in positive territory up 1.56%, led by emerging markets up 4.4% and the US up 2.0%. Within the international developed markets, down 0.63%, Japanese equities outperformed the UK and Euro zone. The strength in emerging markets was welcomed. Falling oil prices and more importantly, a falling dollar and the prospect for a slowdown in the US interest rate cycle provided a much-needed confidence boost to increase investor appetite in the emerging world.
Global fixed income markets were mostly positive as investors looked to take advantage of relatively attractive yields given the fall in oil and its effects on inflation. US government bonds led the way as the 10-year yield fell 12 bps (0.12 percentage points) to finish the month yielding 3.02%. Bond yields in the Euro zone fell in response to positive news from Italy regarding a willingness to alter its target budget deficit while in the UK, yields rose as Brexit talks continue to face issues.
In Focus: Model Portfolios
Overall the global economy continues to expand, however, regional differences remain. In general, the US economy has proven to be resilient amid many geopolitical risks, and the risk of a US recession in the next 12 months remains low; however, tightening US monetary policy and trade tensions, present clear downside risks. Slowing economic momentum (outside of the US) has been a trend throughout 2018, and, if not for fiscal stimulus in the US, would have likely been the same at home. As we end the year, we are making several changes to our model portfolios in anticipation of the investment environment ahead.
First, we have maintained 5% overweight to global equities versus bonds for the last 18 months. This decision was predicated on the belief that economic conditions accommodated higher equity prices as we entered the latter stages of the current bull market. While in hindsight this was a good decision (equities have outperformed bonds), our tilts to value and a market weight allocation to international equities were a drag on performance versus US stocks. As we enter 2019, the economic picture is murky. The US looks solid; however, we have concerns regarding future earnings growth in the face of tighter financial conditions. International equities have more attractive valuations, but face many political headwinds and softening economic momentum indicators that are likely to give investors pause. To this end, we believe it is prudent to reduce our 5% overweight in equities by adding to bonds. Volatility is likely to increase in the months ahead and this change should help smooth the ride some.
Second, within our bond allocation, we have had an overweight to lower credit bonds. Much like our decision to overweight equities, our overweight to lower credit (within the bond portfolio) was based on an accommodating economic environment along with the threat of rising interest rates (lower credit bonds tend to do better vs. higher credit bonds in periods of strong equity performance and rising interest rates). This decision also worked out well as lower credit investments outperformed the broader bond markets. As we look forward, our overweight to credit adds additional risk to our portfolios in the event that equities struggle. Furthermore, rising interest rates are less of a threat as we enter the later stages of the Fed’s cycle. We therefore intend to reduce our lower credit exposure and go “up in quality” by adding more higher quality bonds that should be better positioned going forward.
We plan to institute these changes by year end so there is likely to be activity in your accounts over the coming weeks. All changes will be made in a higher cost and tax efficient manner.
As always, we are happy to discuss these issues in more detail with you and we thank you for your trust.
Year-End Tax Estimate
At the end of each calendar year, mutual funds must distribute their annualized net capital gains (I.e. gains and losses accrued via trading securities through out the year) to shareholders. The status of any distributions (i.e. whether or not they are considered short-term or long-term) depends on how long the fund owned the securities that produced the gains. It does not depend on how long an investor has been invested in the fund. Distributions made using three different dates:
Record date – date that is used declare who owns the fund and is due a distribution
Ex-dividend date – date that the fund trades without the distribution (investors who buy the fund on the ex-dividend date, will not receive a distribution)
Payable date – the date the distribution will be payed to investors.
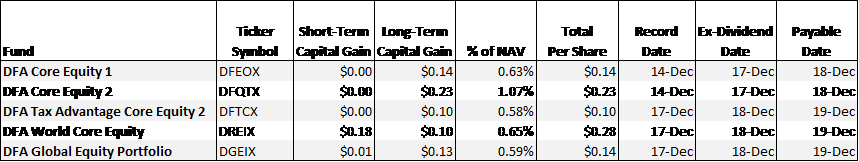
Given the volatility and anemic returns we have experienced over the course of 2018, it is not surprising that a majority of funds we are invested in will not be distributing any capital gains this year. Below is a table of some of our largest client holdings and their year end distribution estimates.
Monthly Economic News
• Employment: Total employment rose by 250,000 in October after adding 180,000 (revised) new jobs in September. The average monthly employment gain over the last 12 months is 211,000. Notable employment increases for the month occurred in leisure and hospitality (42,000), professional and business services (35,000), manufacturing (32,000), health care (36,000), transportation and warehousing (25,000), and construction (30,000). The unemployment rate remained at 3.7% in October. The number of unemployed persons was little changed at 6.1 million. Over the year, the unemployment rate and the number of unemployed persons declined by 0.4 percentage point and 449,000, respectively. The labor participation rate rose 0.2 percentage point to 62.9%. The employment-population ratio increased 0.2 percentage point to 60.6%. The average workweek increased 0.1 hour to 34.5 hours in October. Average hourly earnings increased by $0.05 to $27.30. Over the last 12 months, average hourly earnings have risen $0.83, or 3.1%.
• FOMC/interest rates: The Federal Open Market Committee met in November but declined to raise interest rates, which remained at their current 2.00%-2.25% range. The next meeting is scheduled for December 18-19. Following its September meeting, the Fed forecast one more rate hike this year. However, it may push that rate change into 2019, unless it determines that economic expansion and/or inflation are ratcheting up too fast.
• GDP/budget: According to the second estimate, the third-quarter gross domestic product increased at an annual rate of 3.5%. The second-quarter GDP grew at an annualized rate of 4.2%. The economy has expanded for nine consecutive years, the second longest such streak on record. Spending by consumers and state and local governments receded in the third quarter. Business investment and inventories are up, likely due to companies trying to stockpile in anticipation of tariffs driving import prices higher. October is the first month of fiscal 2019 for the federal government. There was a $100.5 billion deficit in October, with government receipts totaling $252.7 billion, offset by $353.2 billion in expenses. The biggest expenditures in October were for Social Security ($84 billion), national defense ($69 billion), and Medicare ($53 billion). In October the government collected $129 billion in individual income taxes, but only $8 billion in corporate income taxes.
• Inflation/consumer spending: Inflationary pressures were subdued in October, while consumer spending was strong. According to the Personal Income and Outlays report, prices for consumer goods and services rose only 0.2% in October following a 0.1% increase in September. Core consumer prices (excluding food and energy), a tracker of inflationary trends, increased 0.1%. Core prices have increased 1.8% over the 12 months ended in October — 0.2 percentage point below the Federal Reserve's target for inflation. Consumer spending climbed 0.6% in October after jumping 0.2% (revised) in September. Consumer income (both pre-tax and after-tax) rose 0.5%, respectively, for the month.
The Consumer Price Index rose 0.3% in October after increasing 0.1% in September. Over the last 12 months ended in October, consumer prices are up 2.5%. Core prices, which exclude food and energy, climbed 0.2% for the month and are up 2.1% over the last 12 months.
According to the Producer Price Index, the prices companies received for goods and services jumped 0.6% in October following a 0.2% increase in September. Producer prices have increased 2.8% over the 12 months ended in October. Prices less food and energy gained 0.5% in October, and are up 2.6% over the last 12 months.
• Housing: New home sales fell 8.9% in October after declining 1.0% in September (revised) and are down 12.0% from the October 2017 estimate. The median sales price of new houses sold in October was $309,700 ($321,300 in September). The October average sales price was $395,000 ($379,000 in September). Inventory rose to an estimated 7.4-month supply, slightly ahead of September's 7.1 months. Following six straight months of decreases, sales of existing homes increased 1.4% in October. Year-over-year, existing home sales are down 5.1%. The October median price for existing homes was $255,400, down from $258,100 in September. However, existing home prices are up 3.8% from October 2017. Total housing inventory for existing homes for sale fell from 1.88 million in September to 1.85 million in October, rendering a 4.3-month supply at the current sales pace.
• Manufacturing: The manufacturing sector slowed in October. Industrial production edged up 0.1% following a 0.3% advance in September. For the 12 months ended in October, industrial production has advanced 4.1% — down from the 5.1% annual gain in September. Manufacturing output increased 0.3% following a 0.2% increase in September. The indexes for mining and for utilities declined 0.3% and 0.5%, respectively. New orders for long-lasting durable goods fell 4.4% in October following a revised September report that moved from an 0.8% gain to 0.1% a decline. Durable goods orders excluding transportation inched up a scant 0.1%.
• Imports and exports: The advance report on international trade in goods revealed that the trade gap expanded in October (the first month of fiscal 2019) to $77.2 billion — up from $76.3 billion in September. Compared to the prior month, October exports of goods decreased $0.8 billion to $140.5 billion, while imports rose $0.2 billion to $217.8 billion. Prices for imported goods grew by 0.5% in October after climbing 0.2% (revised) in September. Export prices increased 0.4% in October following no price change in September. Over the last 12 months ended in October, import prices are up 3.5%, while export prices have advanced 3.1%.
• International markets: The British pound remained at historically weak levels, influenced by the ongoing Brexit ordeal. The next major action in the ongoing drama involving the United Kingdom's withdrawal from the European Union occurs on December 11, when the UK Parliament is set to vote on the proposed agreement to leave the EU. Analysts suggest that parliamentary approval of the deal is tenuous at best. A "no" vote could lead to several possible outcomes. On the trade front, heading into a meeting between President Trump with President Xi Jinping of China at the Group of 20 (G20) summit, President Trump threatened additional tariffs on Chinese imports if the meeting did not produce a favorable outcome for the United States.
• Consumer confidence: The Conference Board Consumer Confidence Index® declined in November, following an improvement in October. While consumers' assessment of current business and labor market conditions improved slightly, consumers' short-term outlook for income, business, and labor market conditions waned.