
Small Caps Have Done Better Than You Think
US small caps have actually performed near their long-term average, while the S&P 500’s decade of outsized gains—driven by mega-cap tech—looks far less typical. The contrast suggests investors may be questioning small caps when large caps are the real outlier in the market.
One of the most common questions I hear is, “What’s wrong with small caps?” This concern usually stems from relative returns over the past 10 years, during which US small caps underperformed the S&P 500 Index by a little over 4 percentage points. But which one of these asset classes has been behaving abnormally?
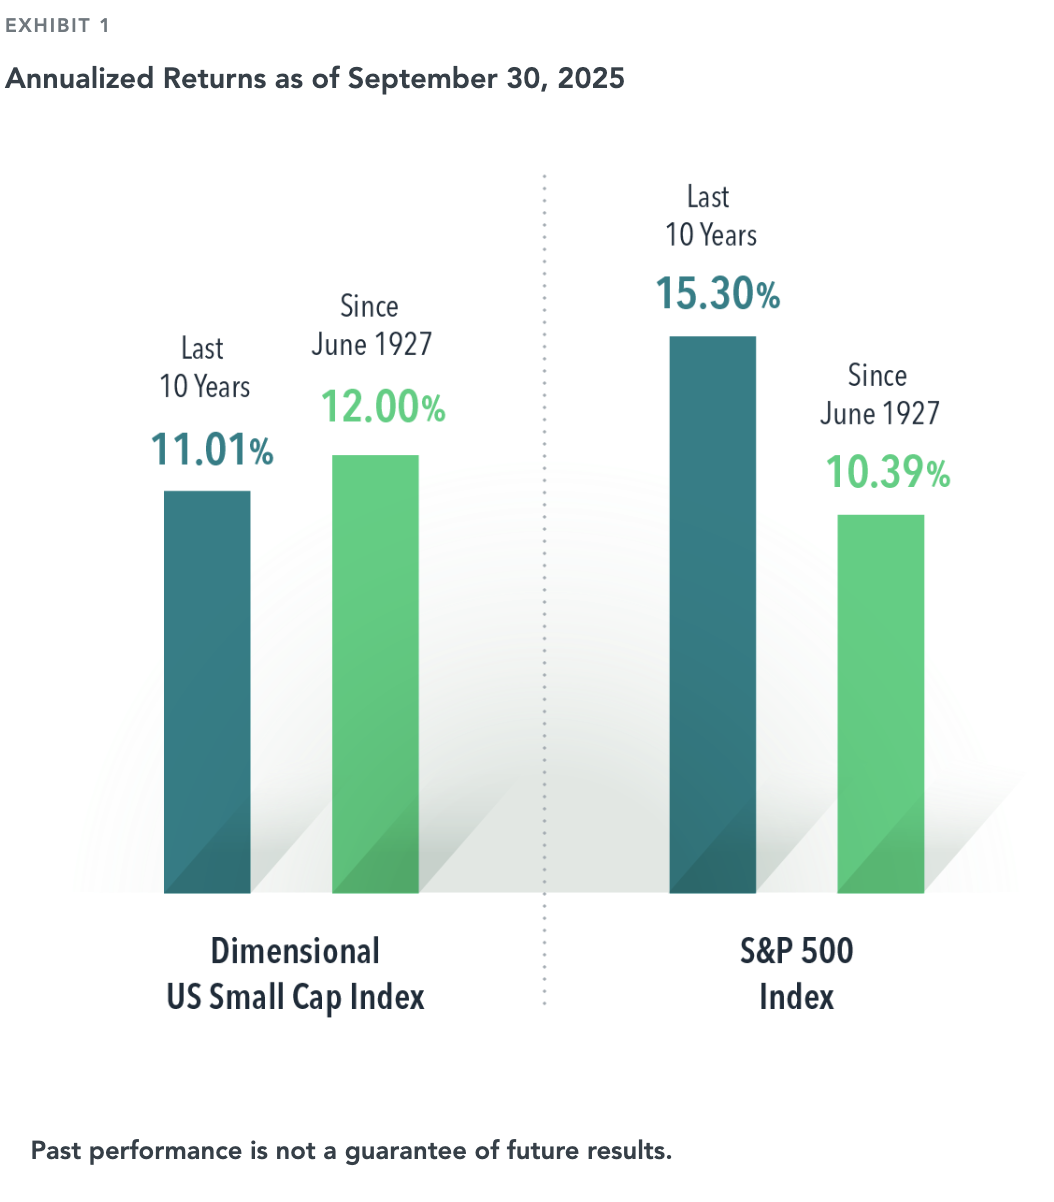
US small cap’s return over the last decade was within 1 percentage point of its average since 1927, at 11.01% versus 12.00%. The large cap S&P 500, on the other hand, was far from its long-run average. The index returned more than 15% over the last 10 years, nearly 50% more than its average since 1927 of 10.39%.
The S&P 500 has substantial weight in companies like the Magnificent 7, which have exceeded investor expectations with their earnings growth in recent years¹. When investors are surprised in a good way, outsize returns may follow. That’s a windfall for investors with diversified portfolios. But expecting a continuation of large cap returns well in excess of the historical norm is betting on further unexpected success stories for these firms.
Many people have been searching for stories to explain US small cap underperformance. We’ve written previously about looking at the bigger picture with small cap returns and how some of the concerns over the current opportunity set may be overblown. But the stark contrast between short-term and long-term large cap returns suggests maybe investors are questioning the wrong segment of the market.
Glossary
Annualized return: The compound performance of an investment expressed on a per-year basis.

Relative return: A measure of the return of one investment relative to another.

Large cap: Refers to a company with a relatively large market capitalization.

Small cap: Refers to a company with a relatively small market capitalization.

Index Descriptions

The Dimensional indices have been retrospectively calculated by Dimensional Fund Advisors LP and did not exist prior to their index inception dates. Accordingly, results shown during the periods prior to each index’s inception date do not represent actual returns of the index. Other periods selected may have different results, including losses. Backtested index performance is hypothetical and is provided for informational purposes only to indicate historical performance had the index been calculated over the relevant time periods. Backtested performance results assume the reinvestment of dividends and capital gains.


Dimensional US Small Cap Index was created by Dimensional in March 2007 and is compiled by Dimensional. It represents a market-capitalization-weighted index of securities of the smallest US companies whose market capitalization falls in the lowest 8% of the total market capitalization of the eligible market. The eligible market is composed of securities of US companies traded on the NYSE, NYSE MKT (formerly AMEX), and Nasdaq Global Market. Exclusions: non-US companies, REITs, UITs, and investment companies. From January 1975 to the present, the index excludes companies with the lowest profitability and highest relative price within the small cap universe. The index also excludes those companies with the highest asset growth within the small cap universe. Profitability is measured as operating income before depreciation and amortization minus interest expense scaled by book. Asset growth is defined as a change in total assets from the prior fiscal year to current fiscal year. Source: CRSP and Compustat. The index monthly returns are computed as the simple average of the monthly returns of 12 subindices, each one reconstituted once a year at the end of a different month of the year. The calculation methodology was amended in January 2014 to include profitability as a factor in selecting securities for inclusion in the index. The calculation methodology was amended in December 2019 to include asset growth as a factor in selecting securities for inclusion in the index.

Footnotes

1. The Magnificent 7 stocks are represented by Alphabet, Apple, Amazon, Meta, Microsoft, NVIDIA, and Tesla. This information is intended for educational purposes and should not be considered a recommendation to buy or sell a particular security. Named securities may be held in accounts managed by Dimensional.
Disclosures

The information in this material is intended for the recipient’s background information and use only. It is provided in good faith and without any warranty or representation as to accuracy or completeness. Information and opinions presented in this material have been obtained or derived from sources believed by Dimensional to be reliable, and Dimensional has reasonable grounds to believe that all factual information herein is true as at the date of this material. It does not constitute investment advice, a recommendation, or an offer of any services or products for sale and is not intended to provide a sufficient basis on which to make an investment decision. Before acting on any information in this document, you should consider whether it is appropriate for your particular circumstances and, if appropriate, seek professional advice. It is the responsibility of any persons wishing to make a purchase to inform themselves of and observe all applicable laws and regulations. Unauthorized reproduction or transmission of this material is strictly prohibited. Dimensional accepts no responsibility for loss arising from the use of the information contained herein.

This material is not directed at any person in any jurisdiction where the availability of this material is prohibited or would subject Dimensional or its products or services to any registration, licensing, or other such legal requirements within the jurisdiction.

“Dimensional” refers to the Dimensional separate but affiliated entities generally, rather than to one particular entity. These entities are Dimensional Fund Advisors LP, Dimensional Fund Advisors Ltd., Dimensional Ireland Limited, DFA Australia Limited, Dimensional Fund Advisors Canada ULC, Dimensional Fund Advisors Pte. Ltd., Dimensional Japan Ltd., and Dimensional Hong Kong Limited. Dimensional Hong Kong Limited is licensed by the Securities and Futures Commission to conduct Type 1 (dealing in securities) regulated activities only and does not provide asset management services.

RISKS
Investments involve risks. The investment return and principal value of an investment may fluctuate so that an investor’s shares, when redeemed, may be worth more or less than their original value. Past performance is not a guarantee of future results. There is no guarantee strategies will be successful.