
The Evolution of Small Cap Investing: Four Decades of Innovation at Dimensional
Over the past 20 year, 92% of Dimensional’s small cap funds outperformed their benchmarks vs. only 30% industry-wide.
KEY TAKEAWAYS
In 1981, Dimensional launched the US Micro Cap Portfolio, pioneering a systematic approach to value-added small cap investing.
In the ensuing decades, we looked to academic research for insights that could improve our methodology and contribute to new solutions.
Over the 20 years ending December 31, 2022, 92% of Dimensional’s small-cap funds outperformed their benchmarks vs. only 30% industry-wide.
In 1981, Dimensional launched the firm’s first strategy, the US Micro Cap Portfolio (DFSCX), pioneering a systematic approach to investing in small capitalization stocks, also known as small caps. Today, this portfolio has a live track record of over 40 years. Since its inception, Dimensional’s original portfolio has outperformed its benchmark, the Russell 2000 Index, by 1.5% net of fees and expenses on an annualized basis. That means $1 invested in the US Micro Cap Portfolio would have grown to over $88 during the 41-year period, compared to approximately $49 in a fund tracking the Russell 2000.
Exhibit 1
US Micro Cap’s Multidecade Track Record
Growth of $1 and annualized performance for US Micro Cap Portfolio (DFSCX) and Russell 2000 Index
Returns as of June 30, 2023.

Performance data shown represents past performance and is no guarantee of future results. Current performance may be higher or lower than the performance shown. The investment return and principal value of an investment will fluctuate so that an investor's shares, when redeemed, may be worth more or less than their original cost. To obtain performance data current to the most recent month end, visit dimensional.com. Performance includes reinvestment of dividends and other earnings.
Data presented in the Growth of $1 chart is hypothetical and assumes reinvestment of income and no transaction costs or taxes. The chart is for illustrative purposes only and is not indicative of any investment. Frank Russell Company is the source and owner of the trademarks, service marks, and copyrights related to the Russell Indexes.
Over the decades since the launch of the US Micro Cap Portfolio, we have broadened our offering of portfolios that invest in small cap stocks in the US and abroad, as shown in Exhibit 2. Along the way we have also developed deep expertise into what drives expected returns across small stocks and how to capture these returns. Ongoing work from academics and Dimensional’s research and investment teams has contributed to this evolution.
Exhibit 2
Four Decades of Small Cap Investing

Includes Dimensional US-domiciled, USD-denominated open-end mutual funds and ETFs that invest in small and mid-cap stocks.
Early Days: Accessing Small Caps
Dimensional Founder David Booth recounts from the firm’s early days the opportunity to invest in an overlooked area of the market: “The motivation for the firm was to develop a new investment strategy based on company size—we called it a ‘small cap fund.’ ” He notes that at the time, big institutions tended to invest in stocks of large companies, with the only small caps they held generally being stocks that were once large and now had become small. He recollects that “people didn’t even use the term ‘small cap’ back in 1981,” adding, “…with that bit of logic, that’s how we got started.”
From the beginning, Dimensional focused on implementing ideas from academic research in innovative and cost-efficient ways. In 1981, Rolf Banz of the University of Chicago published research pointing to a so-called “size effect.” (1) The research showed that smaller-capitalization stocks in the US tended to have higher returns than larger-capitalization names. The challenge was how to capture the returns of smaller-capitalization stocks without incurring high trading costs in this less liquid part of the market. Dimensional’s approach to managing these costs was the same then as it is today: By using a flexible, daily portfolio management process and steering away from a more rigid approach of closely tracking an index, the US Micro Cap Portfolio was not constrained to buy illiquid names at inopportune moments.
Though market mechanics have changed in the past 40 years, our trading philosophy has stayed the same. Exhibit 3 quantifies this benefit in recent years: Compared to an approach that demands immediate execution, Dimensional has been able to buy and sell US small-cap stocks at an average pricing advantage of greater than 10 basis points (bps) from 2018 to 2022, with similar outcomes in other developed and emerging markets. Notably, these advantages have helped small and large caps alike and have been even greater in periods of market uncertainty, such as March 2020, adding support for the trading philosophy that first made broad-based small-cap investing viable in 1981.
Exhibit 3
Relative Price Advantages of Flexible Trading in Small Caps across Regions
Dimensional price advantage in equity trades vs. demanding immediacy (bps), 2018-2022

Past performance is no guarantee of future results.
Price advantages estimated relative to demanding immediacy, represented by an approach that sells at the bid and buys at the offer (SBBO).
Monthly average price advantages over SBBO in basis points (bps). Source: Dimensional. Small cap is defined as approximately the bottom 8% of market cap within the US, bottom 12.5% of market cap within each non-US developed markets country, and bottom 15% of market cap within each emerging markets country. Small cap stocks with the lowest profitability and lowest book-to-market ratios are excluded. For more information and a description of the methodology used, see Jerry Liu and Ryan J. Wiley, “Global Trading Price Advantages of Flexible Equity Portfolios” (research paper, Dimensional Fund Advisors, June 2021).
The Value Breakthrough
An important development for small cap investing came in the early 1990s with ongoing research on the value premium, which provided evidence for the outperformance of stocks with lower valuation ratios. In 1992, Professors Eugene Fama and Ken French published the three-factor asset pricing model, which improved upon the single-factor Capital Asset Pricing Model and saw the formal addition of both size and value as systematic drivers of differences in expected returns across equities. This produced a sea change in how funds were evaluated—soon it became important for funds to specify which style (value or growth) or size (small, large) they were pursuing.
An important development for small cap investing came in the early 1990s with ongoing research on the outperformance of stocks with lower valuation ratios.
Dimensional was at the forefront of this evolution. We launched our first two small cap value funds in the early 1990s—the US Small Cap Value Portfolio (DFSVX) in 1993 and International Small Cap Value Portfolio (DISVX) in 1994. Both are among the oldest surviving funds in their Morningstar categories, and since their respective inceptions through June 30, 2023, the two funds outperformed their benchmarks (2) on an annualized basis by 1.7% and 0.5%, respectively. (3) For perspective, $1 invested in the US Small Cap Value Portfolio would have grown to almost $24 for the nearly 30-year period, compared to approximately $15 in a fund tracking the Russell 2000 Value Index.
Applying Momentum
As we broadened our offering of small cap and small cap value portfolios, a distinct characteristic of Dimensional’s approach continued to be flexibility in what names we bought and sold and when. This flexibility allowed us to consider shorter-term drivers of returns in our daily portfolio management process. One of these was momentum. Studies on price momentum show that, in the short term, stocks with large recent underperformance tend to continue to underperform and stocks with large recent outperformance tend to continue to outperform. As our research on stock price momentum continued through the 1990s and 2000s, Dimensional began to integrate momentum considerations.
Dimensional Portfolio Managers seek to avoid buying names with down momentum and to delay selling names with up momentum. As a result, our small cap portfolios are not forced to buy formerly high-flying small stocks as they fall back to earth or to quickly sell stocks that migrate from the small cap market into large caps. Momentum considerations remain integral to our process for managing all equity strategies.
Profitability and High Investment
Valuation theory predicts that there should be differences in expected returns across small caps. Advancement in our understanding of the size premium has taught us that small cap stocks with certain characteristics have tended to underperform and failed to deliver the size premium. We believe we can improve the returns of our small cap portfolios by avoiding these while maintaining broad diversification across the small cap market.
One category of small capitalization stocks with lower expected returns is small growth low profitability firms. Historically, these stocks have had low average returns relative to the broader small cap universe. We see a similar pattern in markets outside the US. Dimensional first began excluding small growth low profitability firms in 2010, and the introduction of profitability more broadly into our process in 2013 further refined those exclusions. Today, profitability considerations are incorporated across all portfolios that purchase small caps, adding to our focus on small caps with higher expected returns.
Like profitability, firm investment gives additional information on expected returns. (4) Consistent with valuation theory, firms that must invest heavily to sustain profits should also have lower cash flows to investors than firms with similar profits but lower investment. All else equal, firms with higher investment and, therefore, lower cash flows should have lower expected returns. Fama and French provided early empirical evidence showing the underperformance of firms with high investment, measured using annual asset growth. (5) Our research finds that the investment effect is mainly driven by small cap stocks with very high levels of asset growth. (6) In 2019, Dimensional began to exclude these high-asset-growth names from strategies investing in small caps, adding again to our roster of daily value-adds.
Securities Lending and Expected Returns
In recent years, a meaningful enhancement to small cap implementation has come from using the information in prices in securities lending markets. When individuals want to borrow shares of stock (for example, to sell a share short), they may borrow those shares from a current shareholder and, in exchange, provide collateral to a lender and pay a fee set by the market. As with stock prices, Dimensional found that securities lending prices also contain information. Particularly, we noted that small cap stocks that were expensive to borrow relative to other small cap stocks tended to have worse performance over shorter horizons. We enhanced our small cap investing process by excluding these stocks from purchase, similar to how we treat down momentum stocks, as shown in Exhibit 4. When choosing between two otherwise eligible names, if a stock is expensive to borrow or exhibiting down momentum, Dimensional has the discretion not to buy these names.
Exhibit 4
Excluding Names with Poor Near-Term Outlooks
Momentum and securities lending prices contain information about short-term expected returns.

For illustrative purposes only.
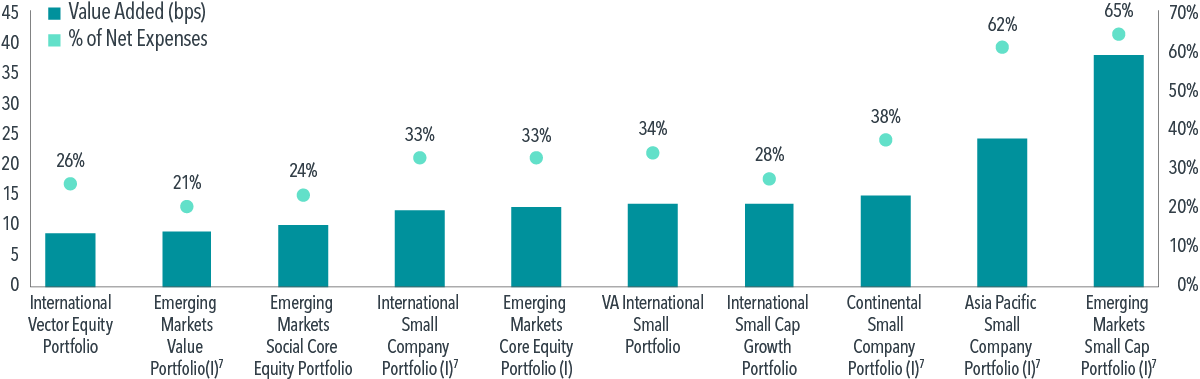
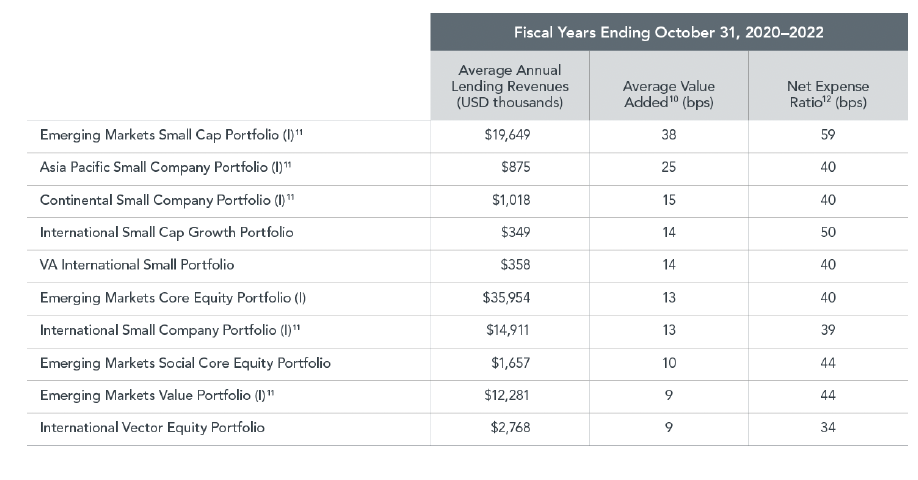
In addition to informing purchase decisions, the securities lending marketplace has also provided Dimensional with opportunities to lend securities and return borrowing fees to fund shareholders, helping to offset fund expenses. Exhibit 5 shows Dimensional’s top 10 funds when ranked by value added through securities lending revenue over the most recent three years. Notably, securities lending activity in the Emerging Markets Small Cap Portfolio contributed an average 38 bps per year from 2020 to 2022, corresponding to 65% of the fund’s expenses for the period. Similar value has been added across other Dimensional small cap funds, with six of our top 10 contributing funds from Exhibit 5 investing exclusively in small caps. Engaging in securities lending is just one way we seek to reduce final costs for small cap investors.
Exhibit 5
Value Added from Securities Lending
Top 10 equity mutual funds with largest average value added from securities lending for FY2020-FY2022.
Securities lending involves risk—including counterparty risk—and possible loss.
Source: Dimensional funds annual reports. Fiscal years as of October 31 (November 1, 2019–October 31, 2022). Revenue is not guaranteed and may fluctuate. Lending activities are conducted by the custodians for the funds. See Appendix: Securities Lending Adds Value.
See Appendix: Average Annual Total Returns.
Effective Execution Matters
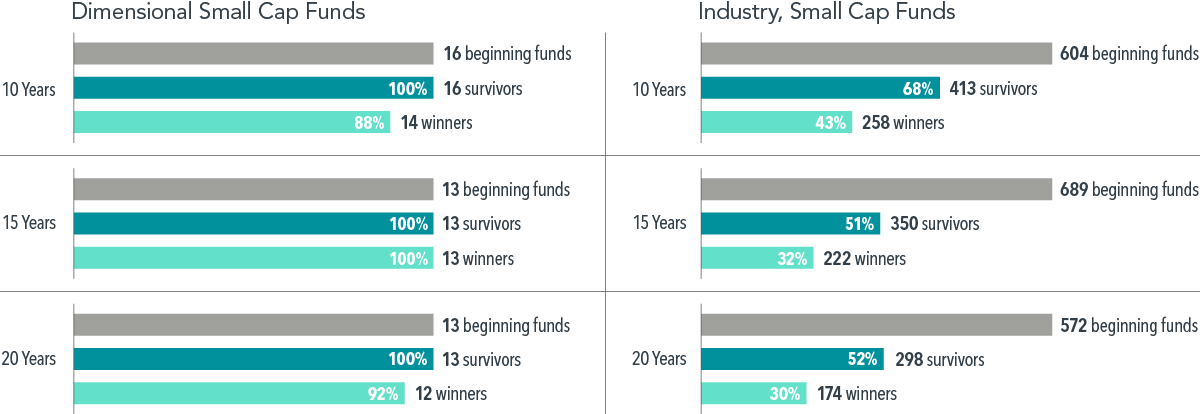
Compared to peer funds, Dimensional’s small cap funds have built an impressive track record. Exhibit 6 shows that, over the 20 years ending December 31, 2022, 92% of Dimensional’s funds have outperformed their prospectus benchmarks, compared to only 30% industry-wide. Drivers of our success have been both our continual evolution and focus on execution.
Exhibit 6
Dimensional’s Small Cap Performance vs. the Industry
Percentage of US-domiciled small-cap funds that survived and outperformed their prospectus benchmarks, as of December 31, 2022
Past performance is no guarantee of future results. Funds may have experienced negative performance over the time period.
Dimensional Small Cap Funds refers to all Dimensional US-domiciled, USD-denominated open-end mutual funds and ETFs that invest exclusively in small and mid cap stocks. Dimensional fund data is provided by the fund accountant. Industry, Small Cap Funds refers to US-domiciled, USD-denominated open-end and exchange-traded funds at the beginning of the 10-, 15-, and 20-year periods for the Morningstar US Small Blend, US Small Growth, US Small Value, Foreign Small/Mid Blend, Foreign Small/Mid Growth, Foreign Small/Mid Value, and Global Small/Mid Stock categories. Non-Dimensional fund data provided by Morningstar. Where the full series of primary prospectus benchmark returns is unavailable, non-Dimensional funds are instead evaluated relative to their Morningstar category index. Surviving funds are those with return observations for every month of the 10-, 15-, and 20-year sample periods. Each fund is evaluated relative to its respective prospectus benchmark as of the start of the 10-, 15-, and 20-year periods. Winners are funds whose cumulative net return over the period exceeded that of their prospectus benchmark.
Index data provided by Bloomberg, MSCI, Russell, FTSE Fixed Income LLC, and S&P Dow Jones Indices LLC. Bloomberg data provided by Bloomberg. MSCI data © MSCI 2023, all rights reserved. Frank Russell Company is the source and owner of the trademarks, service marks, and copyrights related to the Russell Indexes. FTSE fixed income indices © 2023 FTSE Fixed Income LLC. All rights reserved. S&P data © 2023 S&P Dow Jones Indices LLC, a division of S&P Global. All rights reserved.
At Dimensional, we are on a continual search for new research and ideas that may lead to advancements in investing. However, we strive not to lose sight of our foundational focus on smart implementation that has benefited investors over time.
Change is a constant, and we expect the evolution of research and client needs to create new opportunities for investment innovation. At Dimensional, we look forward to continuing this tradition of innovation—in small caps and elsewhere.
APPENDIX
As of June 30, 2023.

Performance data shown represents past performance and is no guarantee of future results. Current performance may be higher or lower than the performance shown. The investment return and principal value of an investment will fluctuate so that an investor's shares, when redeemed, may be worth more or less than their original cost. To obtain performance data current to the most recent month end, visit dimensional.com.
Securities Lending Adds Value
Source for value added and lending revenues: Dimensional funds annual reports. Fiscal years as of October 31 (November 1, 2019–October 31, 2022). Securities lending involves risks. Revenue is not guaranteed and may fluctuate. Lending activities are conducted by the custodians for the funds.
FOOTNOTES
Rolf W. Banz, “The Relationship between Return and Market Value of Common Stocks,” Journal of Financial Economics 9, no. 1 (March 1981): 3–18.
The prospectus benchmarks of the US Small Cap Value Portfolio and International Small Cap Value Portfolio are, respectively, the Russell 2000 Value Index and the MSCI World ex USA Small Value Index (net div.)
Source: Morningstar.
Savina Rizova and Namiko Saito, “Investment and Expected Stock Returns” (research paper, Dimensional Fund Advisors, July 2020).
Eugene F. Fama and Kenneth R. French, “Profitability, Investment, and Average Returns,” Journal of Financial Economics 82, no. 3 (December 2006): 491–518.
Rizova and Saito, “Investment and Expected Stock Returns.”
Lending revenue reflects the proportional share of the securities lending revenue generated by the master fund(s) that was received by the portfolio.
Performance information as of June, 30, 2023.
Net expense ratio information as of the prospectus dated February 28, 2023. Certain portfolios have entered into fee waiver and/or expense assumption arrangements with the advisor. In these cases, the advisor has contractually agreed, under certain circumstances, to waive certain fees and/or assume certain expenses of the portfolio. Unless otherwise stated in the prospectus, the advisor may amend or discontinue these arrangements at any time, one year from the date of the prospectus. The net expense ratio reflects the total annual fund operating expenses of the portfolio after taking into account any such fee waiver and/or expense assumption arrangements. Please read the portfolio’s prospectus for details and more information.
Value added represents the estimated impact on fund performance from revenue generated from securities lending activity expressed in basis points of fund average net assets.
Lending revenue reflects the proportional share of the securities lending revenue generated by the master fund(s) that was received by the portfolio.
Expense ratio information is as presented in the prospectus dated February 28, 2023. Under certain circumstances, the advisor has contractually agreed to waive certain fees and/or assume certain expenses of the portfolio. Unless otherwise stated in the prospectus, the advisor may amend or discontinue the waivers at any time, one year from the date of the prospectus. The net expense ratio reflects the total annual fund operating expenses of the portfolio after taking into account any such fee waiver and/or expense reimbursement arrangements. Please read the portfolio’s prospectus for details and more information.