
Think Twice about Chasing the Biggest Stocks
As companies grow to become some of the largest firms trading on the US stock market, the returns that push them there can be impressive. But not long after joining the Top 10 largest by market cap, these stocks, on average, lagged the market.
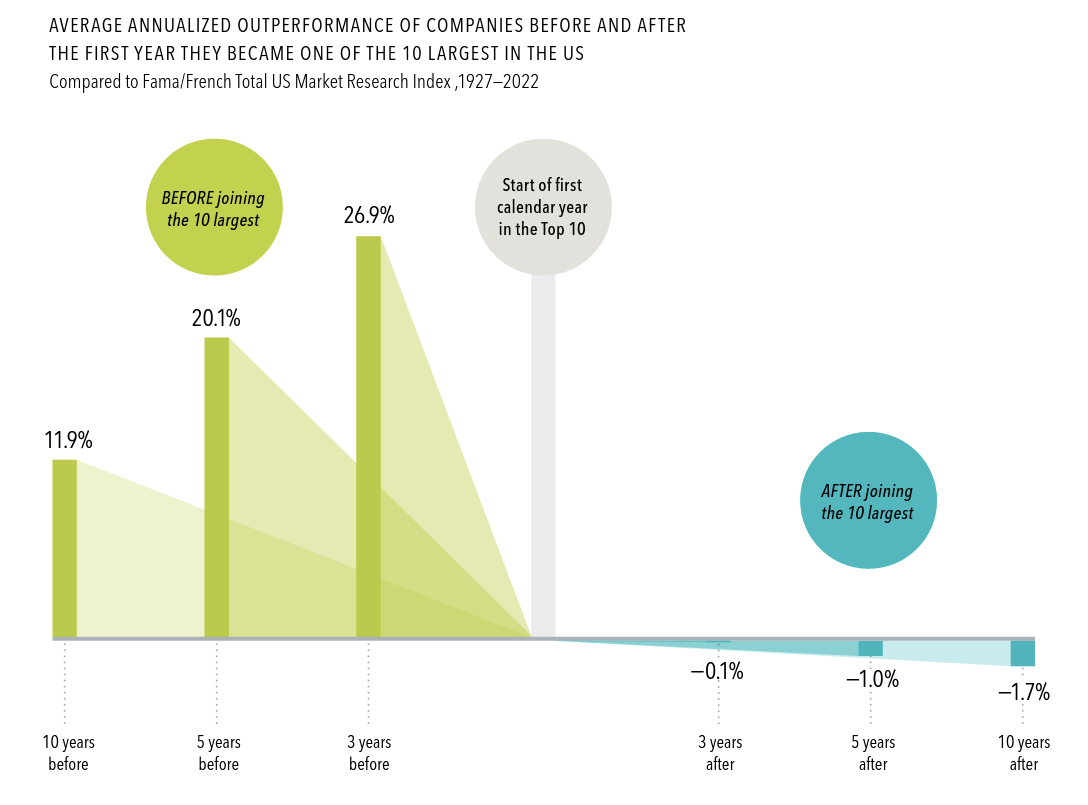
As companies grow to become some of the largest on the US stock market, their returns can be impressive. But not long after joining the Top 10 largest by market cap, these stocks, on average, have lagged behind the market.
From 1927 to 2022, the average annualized return for these stocks over the three years prior to joining the Top 10 was more than 25% higher than the market.
Three years after joining the Top 10, these stocks were, on average, underperforming the market— a stark turnaround from before. The gap was even wider five years out.
Expectations about a firm’s prospects are reflected in its current stock price. Positive news might push prices higher, but those changes are not predictable.
Past performance is no guarantee of future results.
This information is intended for educational purposes and should not be considered a recommendation to buy or sell a particular security. Named securities may be held in accounts managed by Dimensional.
In USD. Source: Dimensional, using data from CRSP. Includes all US common stocks excluding REITs. Largest stocks identified at the end of each calendar year by sorting eligible US stocks on market capitalization. Market is represented by the Fama/French Total US Market Research Index. Ten largest companies by market capitalization. Returns after joining the 10 largest are measured as of the start of the first calendar year after a stock joins the Top 10. Annualized excess return is the difference in annualized compound returns between the stock and the market over the three-, five-, and 10-year periods, before and after each stock’s initial year-end classification in the Top 10. Three-, five-, and 10-year annualized returns are computed for companies with return data available for the entire three-, five-, and 10-year periods, respectively. The number of firms included in measuring excess returns prior (subsequent) to becoming a Top 10 stock consists of 42 (55) for the three-year period, 41 (54) for the five-year period, and 33 (47) for the 10-year period.